Tue 23 Oct 2007
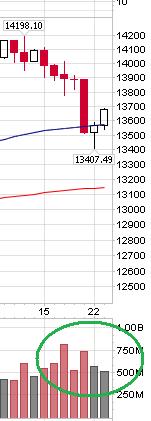
 After two up days, and plenty of celebration over Apple and similar tech profits it’s easy to think that Friday’s drop was just a single bad day, overdone because of option expiration and what not… But one thing to keep an eye on over the next few days is the volume on up or down days…
Over the last week, we’ve seen what technicians would call a low-volume bounce. To the right is a segment of the chart of the last two weeks of the Dow 30. The biggest volume came on down days, and yesterday and today, both up days, had relatively low volume.
I’d want to see volume return on the up days before declaring the market in good health…
It’s also worth noting that the banking sector has been under-performing the rest of the market. John suggested recently that this might be a good leading indicator that the market still faces trouble, and I agree. This is another red flag for me…
What do you guys think? Is is time to be bullish due to the market’s ability to rally even with constant subprime fiascoes and credit market meltdowns? Or is this just a sucker’s rally?
October 23rd, 2007 at 10:53 pm
One of the big news points for tomorrow will be momentum favorite Amazon… earnings were lower than expected and the price is off by 10% in after-market trading. Of course, it was up 10% in normal trading today, so it’s back where it was yesterday. This will be one to watch tomorrow as it could easily sway the mood in one direction or another.
October 24th, 2007 at 9:55 pm
One other red flag despite today’s midday recovery… breadth remains poor with about two declining stocks for every one that advanced today.
The impact of breadth is important… for example, Apple has accounted for 34% of the return for the NDX year-to-date. Market cap weighted indexes over-emphasize the winners and can easily hide weakness across a larger number of stocks.
It’s also worth noting that the reversal / buying today hit at 2pm. Two in the afternoon seems to be the magic number in intra-day buying…
If anything, today (Wed)’s dip and reversal shows how indecisive the market is, and how volatility is going to be a major factor which ever way the indexes go.