Commentary


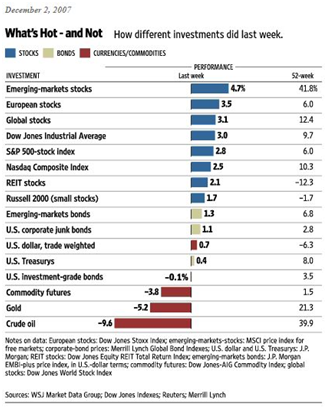
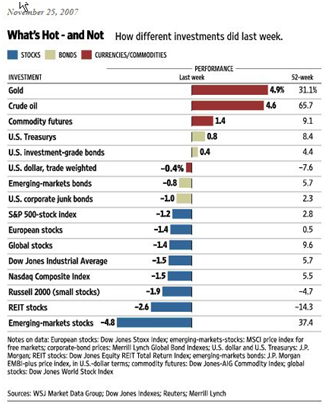
The last two weeks have been quite the opposite of each other… Here is the WSJ’s weekly roundup of market performance for the weeks ending 12/2 (first chart) and 11/25 (second chart).

See anything notable? The best performers one week are the worst performers the next week (and vice versa).

Bill Cara recently noted that the efficient pricing mechanism of the markets has broken. Volatility is the result, and we have plenty of that.

Here is a website listing all the REOs for Countrywide Financial in North Carolina.? REOs are the post-foreclosure properties where the owner has defaulted and the bank has collected the property as collateral on the unpaid loan.

CFC’s REOs in North Carolina

The official list is also available from Countrywide’s website.

I’ve been checking out a blog called Bespoke recently, and it’s a pretty good financial blog.? They have frequent, well informed, and fairly short tidbits about things they notice in the markets.

Today, they had an interesting tidbit…? Van Gogh: The Art World’s Sub Prime Paper?

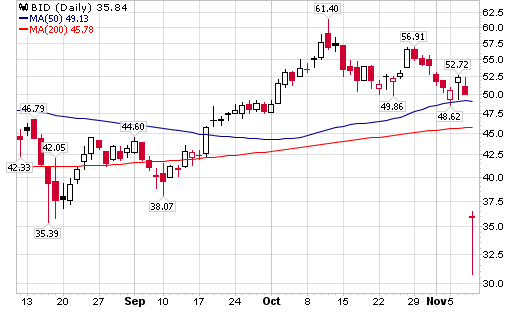
Today, Sotheby’s (BID) is down nearly 30% after a weak auction last night where a Van Gogh that was estimated to sell for between $28-$35 million received no bids.

Here’s a 3 month chart of BID:

bid.png

Ouch!

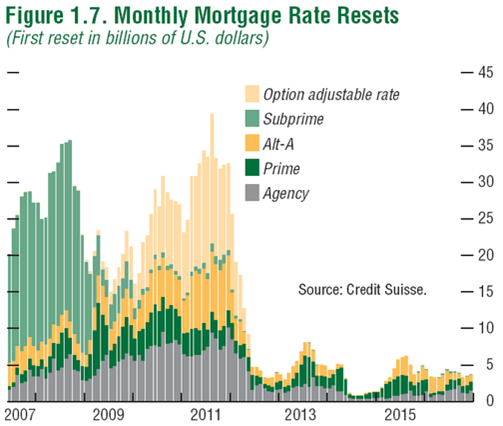
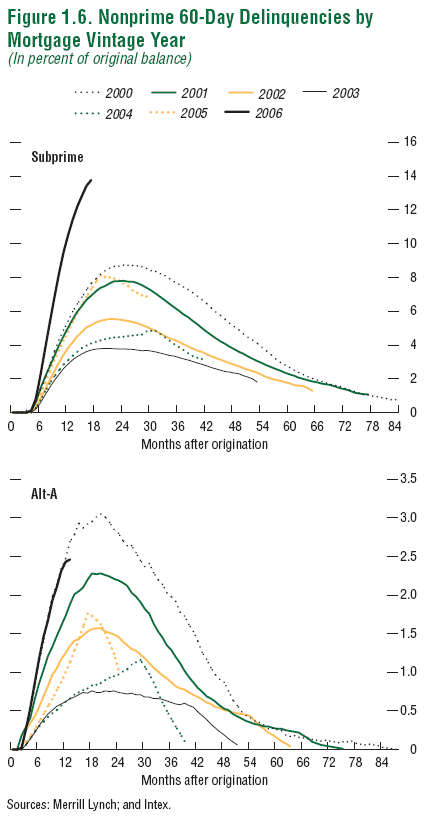
From over at The Big Picture, we have two interesting graphics that show the difficulty in the mortgage and housing markets.

The ongoing APR mortgage reset process isn’t expected to peak until some time in 2008. Following that, we see a new surge in resets, as Option Adjustable Mortgages begin to come up in 2010-11. Note that these are non-subprime mortgages.

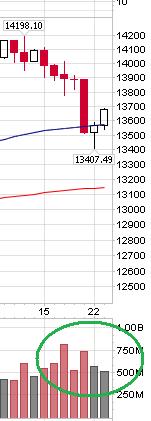
dow30lowvol.jpgAfter two up days, and plenty of celebration over Apple and similar tech profits it’s easy to think that Friday’s drop was just a single bad day, overdone because of option expiration and what not… But one thing to keep an eye on over the next few days is the volume on up or down days…

Over the last week, we’ve seen what technicians would call a low-volume bounce. To the right is a segment of the chart of the last two weeks of the Dow 30. The biggest volume came on down days, and yesterday and today, both up days, had relatively low volume.

I’d want to see volume return on the up days before declaring the market in good health…

It’s also worth noting that the banking sector has been under-performing the rest of the market. John suggested recently that this might be a good leading indicator that the market still faces trouble, and I agree. This is another red flag for me…

What do you guys think? Is is time to be bullish due to the market’s ability to rally even with constant subprime fiascoes and credit market meltdowns? Or is this just a sucker’s rally?

Over on CXO Advisory, they talk about a recent study of hedge funds and what characteristics mark the good ones. The conclusion was:

In summary, hedge funds that conservatively smooth out market bumps with minimal net exposure to equities and mid-range returns tend to be the most reliable outperformers.

Translation: The hedge funds that actually hedge perform best. The modern hedge fund has become a catch-all for any type of investing, including all out Wild West directional plays. But those that actually attempt to have neutral market exposure plus some alpha rule the day. Brilliant!

Here is a chart from the NY Times covering the resale price of existing homes.

nyt-housing-chart.jpg

The chart is adjusted for inflation. While the purpose of the chart is to say that some people saw the bubble coming… that’s not why it is interesting to me.? There are two other points worth noting.

1. Prices declined from 1989 to 1996 — a whopping 7 years.

2.While prices have fallen, they have not fallen by that much.

So far since the peak in this index, prices have fallen around 6%. Back in the early 90s, prices fell approximately 15% (a guess, I don’t have the energy to dig up the original data series).

I’d probably want to look at a longer data series to draw any additional conclusions from this chart. But, as we’ve discussed before, there are a lot more ARMs that need to reset before the selling pressure subsides…

FYI, MM rates on many banks seem to be heading down. NC SECU just changed their MM rate from 4.5% down to 4% even (on 9/20/2007), ING went from 4.5% down to 4.3% (sometime in Sept). Makes sense though, since the banks will need this extra capital as the foreclosures and credit crunch continues to play out and I’m sure the Fed’s dropping of the discount rate helped further justify this drop. I expect a further slide in the coming months ahead. On a positive note, MM funds like Vanguard’s VMMXX are still holding steady and unchanged, promising a returning 4.97% after expense ratio is accounted for…

I ran across some interesting points in a post titled Buyout Bingo Reversal Continues at Mish’s blog… the big private equity buyouts that were so prevalent only a few months ago include “breakup fees”, meaning fees that need to be paid if the buyout doesn’t go through.

In the case of Harmon International, the fees were $225 million. That means that KKR and Goldman Sachs (the buyers) would owe Harmon a rather large amount of money if the contract is honored. They do claim that their (KKR and GS) businesses have undergone “a material adverse change” and thus they shouldn’t be bound to the contract any more.

The Sallie Mae buyout apparently includes a whopping $900 million breakup fee.

Mish sums the case up pretty well:

None of these deals made any real economic sense but the deals did pad the pockets of the underwriters like Citigroup (C), Merrill Lynch (MER), Goldman Sachs (GS), Lehman (LEH), etc, with lucrative fees at least up until now.

With buyout bingo in reverse, underwriters are paying breakup fees to keep the large loans off their books. As long as investors were willing to take on risk (buy junk at insane prices), the underwriters danced the tune.

It’s telling that Citigroup, Goldman, etc, do not want the deals if they have to provide the funding themselves. Not only do they not want them, they are willing to pay breakup fees to get out of them. That should be enough to tell you who has been and remains the sucker in the deals that do go through: hedge funds and individual investors that buy into them. After all, if Goldman and Citigroup don’t want the deals or the debt, why should you?
Pretty graphics from WSJ (the map on WSJ’s site is interactive and in the free section):

wsj-graphics.jpg

« Previous PageNext Page »

Subscribe to Tasgall

Categories

Archives