Macro


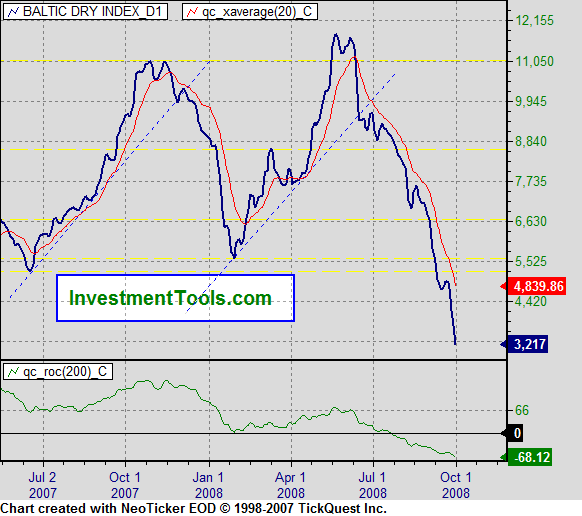
As a note about how quickly things change… the BDI (Baltic Dry Index) has gone from a little over $11,000 in May 2008 to right around $3,200 today. I’m not sure what units that is measured in (dollars per ton per 1000 miles?), but if you’re shipping tons of raw materials by ship, you just saw your shipping costs get cut by over 2/3 in about 5 months.

bdirecent.gif

This isn’t some stock market where we have “evil short sellers” or forced selling through margin calls… and it’s not a bond market where people are refusing to lend each other money… this is the material cost to ship something around the world, and it’s crashing hard.

As a heads up, and as if we needed more reasons to be bearish… the Baltic Dry Index (BDI) is breaking down to new lows for the year

The BDI is a good indicator to follow as a barometer of economic health, so seeing it drop is generally not a good sign. If you like Mish’s blog, you can read more about it with his analysis of the situation.

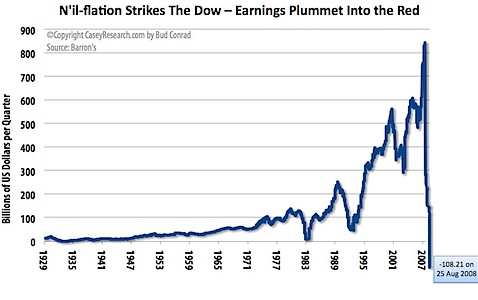
Fascinating chart from Casey Research… the Dow Industrials have their first ever negative quarterly earnings…

DJIndEarningsNeg.jpg

There are some other interesting details on the writeup.

I thought this chart is worth sharing…

20080825.jpg

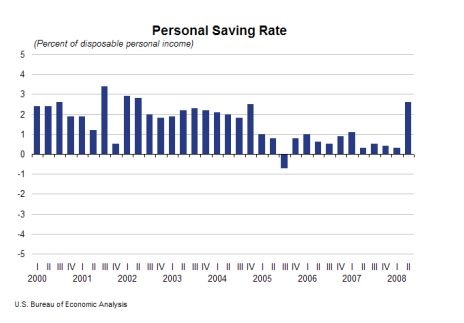
After dwindling to almost zero, the personal savings rate spiked up in the last measured period…

Via The Big Picture’s guest post by Pleur de Plessis:

Richard Russell (Dow Theory Letters): Message to foreign creditors

?We owe our foreign creditors billions of dollars. Furthermore, our foreign creditors already own hundreds of billions of dollars. And our foreign creditors? big worry, among other worries is ? what happens if the dollar really tanks? Foreign holders of US dollars have already lost billions due to the slumping dollar. Yet, above all, the US needs our creditors holding on to their dollars and buying ever-more US bonds. What to do?

?Do you remember Treasury Secretary Paulson rushing all over the world ? Beijing, Moscow, Berlin, Tokyo ? you name it. What was he doing? I think he was beseeching our creditors, ?Look, you?ve got to help us and at the same time help yourself. Hold on to your US bonds, hold on to your Fannie and Freddie paper, keep buying our paper and our bonds. If you don?t, we?re all facing a catastrophe.

??The dollar on a purchasing power parity is ridiculously cheap now. And as soon as possible, we?ll raise rates and that will strengthen the dollar. In the mean time, we?ll talk the strong dollar. And we promise that we will not let the dollar hit the skids. A stronger dollar will help us and help you. Just hold our bonds, hold our paper, and keep buying our bonds. Furthermore, we?ll allow your Sovereign Wealth Funds to buy our assets. Buy all of the US you want. But rest assured, WE WILL DEFEND THE DOLLAR.?

?In my opinion, that was the deal. That was the reason why Paulson was running all over the world with his secret message.?

Source: Richard Russell, Dow Theory Letters, July 30, 2008.

This would argue for a sideways market in the USD, and an end to the continually falling dollar.

In my opinion, it may be a year or two, but the next big trend for the USD will likely be up. Will it be up because of US economic strength? Not really… but rather as the least bad of the global currencies. Europe is more messed up that most people realize (demographically), and they will have trouble maintaining the appearance of unity as the next few years unfold.

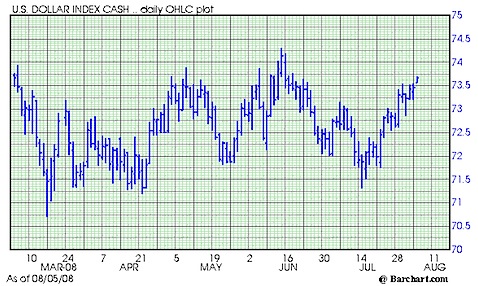
Here’s a side-note… take a look at the following chart of the USD index:

Picture 1.png

You might notice that the dollar has been rising and falling a lot over the last few months… as if constantly oscillating between extremes. This appearance is a side-effect of the way that charting software works… over the last day or two, the days from February have dropped off the left side of the chart, and the price range expanded to fit the entire graph…

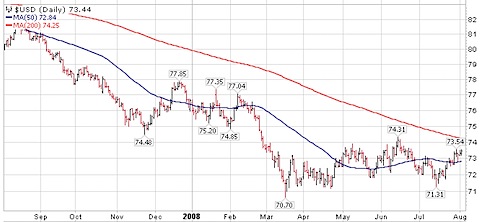
To contrast, here is a 1 year chart where the price range shows a bit more vertical height.

Picture 2.png

The lesson? Be mindful of your chart axis.

I found Kevin Depew’s 5 Things article from Monday (at Minyanville) to have an excellent summation of what a credit crunch is, and why it is important. Here are several excerpts that can act as a primer to anyone wondering what is going on…

1. What is a “Credit Crunch”?

The simple answer is that a “credit crunch” is a general decline in the the supply of, and demand for, credit.

[A] “credit crunch” occurs when banks become more risk averse – less willing to lend – even though interest rates may remain the same, and in extreme cases, even though interest rates may go lower.

2. Why does credit growth matter in the first place?

Because in our [economic] system, economic growth is dependent upon credit expansion.

As long as credit expansion and demand for credit continues at an accelerating pace, the appearance of prosperity continues as asset prices increase. The “accelerating pace” aspect is critical. It is the key to maintaining the boom.

As Michael Darda, chief economist for MKM Partners told the Times today, ?Access to capital and credit is essential to growth. If that access is restrained or blocked, the economic system takes a hit.?

3. What do we mean by “credit expansion,” anyway?

[For almost 20 years, banks lent money] at artificially low interest rates and, later, to borrowers with increasingly low credit quality. By offering willing borrowers money at artificially low rates, this encouraged [taking on more risk and] risk tolerances were widened.

This is how debt was pyramided to such an extent that one small setback, in subprime borrowing for example, resulted in such a widespread problem, problems which quickly spread to other, supposedly safe credit risks.

By offering willing borrowers money at artificially low rates, this encouraged increased time preferences among economic actors, which is to say that investment horizons were lengthened and risk tolerances were widened. This money was then overinvested and misallocated by investors in dot.com ventures and houses.

4. How, then, did we transition from credit expansion to a “Credit Crunch”?

This loss of capital creates risk aversion; lenders suddenly find they are not being repaid, say, by subprime borrowers who are defaulting on their mortgages. These lenders in turn – remember this is a fractional banking system – find that because they used the repayment of these loans as collateral for loans they took out to “malinvest,” suddenly discover they are unable to repay some of their debts. The lender’s lender is in the same boat, as is the lender’s lender’s lender.

So, what do these lenders do? They “de-lever.” In other words, they sell whatever they can – whatever is still liquid (say, U.S. stocks, for example) in order to raise capital to repay loans.

Lenders in many cases cannot, or are no longer willing to, extend credit … for they fear not being repaid.

I have heavily excerpted/edited the original article for content and clarity… see the original if you want it all in the author’s original context.

Additionally, I left off #5, which attempts to answer the question of “What Next?” Depew has a very interesting answer that is very optimistic in its pessimism… Quite entertaining.
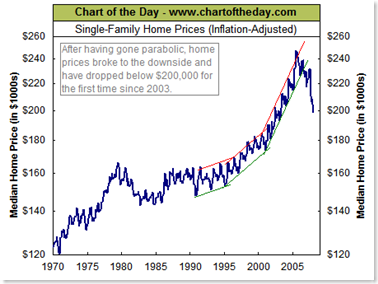
From Chart of the Day

image

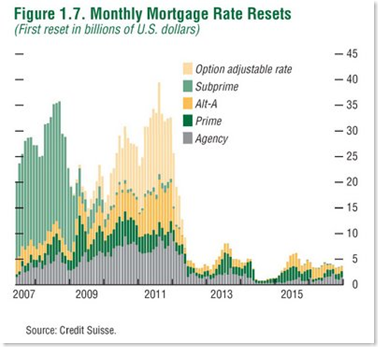
The chart pretty much speaks for itself. In case you want to feel optimistic that maybe the worst is over… It’s worth revisiting the following older chart from Credit Suisse (via Calculated Risk)…

image

It’s worth taking note that the recession calculator is forecasting with a 94% probability* a recession will occur in the next 12 months.  The calculation is based on the current 10 year, 3 month, and overnight rates…

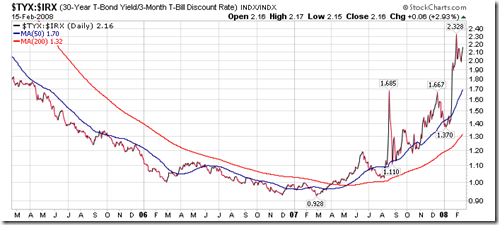
It’s not surprising, considering that the yield spread (30yr/3mo) looks like this:

image


(more…)

It is amusing to hear all the gold bulls, and more recently the mainstream media, proclaim that the Fed is “pumping liquidity” into the system. The logical conclusion is that either the Fed is going to ruin the dollar or save the stock markets, depending on who is talking.

But John Hussman has a different take on it… all the “pumping” is simply the roll-over of short term paper lent to banks. Here is a quote from his December 17 commentary:

Last week, the Fed executed the first of its highly publicized ?term auction? transactions. As I noted in A Little Acid Test for Fed ?Liquidity? last week, the Fed had $53 billion in repos outstanding on Friday December 14, fully $39 billion of which were due to expire last week. This ensured that the Fed would initiate new repos of a similar amount. The acid test was whether the term auction repos would represent a) new liquidity, or b) just a different way of rolling over the same money. Last week, we learned the answer to that question is b.

This will be something to watch, as Hussman points out in Monday’s notes:

…on Friday January 4, the huge 16-day 350 billion EUR refinancing from December 19 expires. This ensures that the media will (misleadingly) report a huge apparent injection of liquidity by the ECB on Friday. The question is how huge.

…As for the Fed, a few of the short-term repos the Fed provided for holiday liquidity will expire on Thursday [Jan 3]. Until then, the extra $10 billion or so of repos in the system may put a bit of pressure on the Fed Funds rate, holding it below the target of 4.25% for a few days. The most likely day for any apparent “liquidity injection” will be that same day (Jan 3) due to the expiring repos…

Fascinating stuff, and quite interesting to peel back beneath the headlines about liquidity injection. Hussman recommends going directly to the Fed or ECB’s websites to see the data yourself; see his full articles for links and more detail on the topic.

Back in my Econ classes, the professors laid out their version of the “proper” way to manage the Fed and the economy. Core to it was the concept of having orderly declines, rather than sharp, abrupt shocks to the system. In the 70s we had oil shocks, in 87 a single-day crash in the markets… If only (the academic argument proposed) the changes could be managed to be orderly, we would be better off as an economy.

As we can see with the current environment, this academic concept seems to have graduated to the policy makers… whether it is an orderly decline in the dollar, or stalling tactics by the Fed to let the financial stocks have an orderly decline (super-SIV anyone?), or spinning the stock markets with well-timed announcements… the Fed and the Treasury are aiming at maintaining order despite problematic situations.

The side-effect of this managed order is a lot of volatility on a short trip. The S&P 500 looks like it will finish the year with a 3.6% gain, despite having a range of over 15% throughout the year (as measured by the distance from 52 week high to 52 week low).

So, is the economy in for a recession, and by implication, is the market preparing for a bear market? I’m not sure… though the arguments are strong in either direction. I think the following quote sums up the bullish posture for me.

Week after week we?ve heard reports about the dangers to housing along with the specter of hundreds of thousands of home defaults. On top of that, we?ve read about the massive losses to the leading banks brought on by the subprime mess. We?ve been warned of a potential collapse in the entire domestic and international banking system. We?ve heard that lending by the big banks had come to a virtual halt.

In the face of all this ghastly news, the November lows in the D-J Averages have held like a rock. Increasingly, it appears, the Averages have discounted the worst that can be seen ahead. As I write, both Averages are well above their November lows.

-Richard Russell (Dow Theory Letters)

Naturally, stock market stability despite economic turmoil is not the final arbiter in our analysis of where the markets will head from here. Market efficiency is a process after all, and the markets may still be coming to grips with economic reality.

That said, I will be watching to see which way the prices break after volume returns in the new year.

« Previous PageNext Page »

Subscribe to Tasgall

Categories

Archives