Research


If you’re comfortable taking on some volatility, you can find some real bargains in the closed-end funds right now.

For example, VVR is a fund that invests in senior debt for corporations. VVR has taken quite a beating in its share price, going from a recent $5 to $6 range to the current $3.70. Here’s the fun part, it’s trading at a 28% discount to the underlying NAV, and is yielding over 14% (as long as the dividend stays at the current rate).

Why such a high yield on a bunch of high-quality senior debt? In a word, panic. If you absolutely gotta get cash, selling a fund like VVR quickly can push the price down dramatically… the daily volume is relatively low, and recent selling has overwhelmed the volume of buyers.

The story is similar with municipal bond fund LEO, with a 21% discount and a tax-free yield over 7%. Compare that to good taxable money market accounts like HSBC Direct at 3.25%, and LEO is looking very attractive.

What’s the risk? High volatility in day-to-day prices, as well as the possibility that some of the bonds held by the funds may default. But as long as you don’t think the world is about to end, these funds are a reasonable investment. (There are other inherent risks to closed-end funds that we’ve discussed before.) Prices could definitely fall further, so as long as the commissions won’t kill your formula, it makes sense to scale into positions over time.

Find more funds like this at www.closed-endfunds.com and do an advanced search. You would also want to look at www.etfconnect.com or MorningStar.com to check the fund’s holdings for anything you’re not comfortable with (several bond funds have FNMA MBS listed as their top 10 holdings…).
On the demand front, both Silver and Zinc will likely get a boost in the future as new battery technology taps both for the next generation of laptop batteries. ZPower is promising higher energy density (to the tune of 40%), more environmental safety (yay recycling), and more chemical stability (a.k.a., fewer exploding laptop batteries).

No need to dive into silver or zinc futures to catch this trend though, the new batteries won’t be out until 2009, and existing laptops won’t be able to take advantage of the tech (new laptops that are designed to work with the new batteries only). That should stall things for a while, but if the 40% bump in energy payoff is real, I can’t imagine laptop makers not wanting a piece of this new tech.

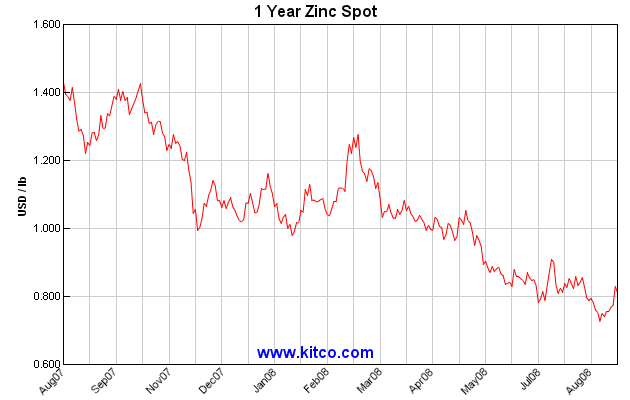
Still, with Zinc in a downtrend since December 2006, this could eventually cause enough demand for a turn of the tide…

spot-zinc-1y-Large.gif

Silver is a different beast and tends to go along with Gold’s direction… and silver also provides the majority of the cost for said silver-zinc batteries.

The FDIC shut down IndyMac over the weekend, and I read the following quote in the International Herald Tribune:

The bank is scheduled to reopen Monday as IndyMac Federal Bank, FSB, under the oversight of the?FDIC.

The FDIC estimates its takeover of IndyMac will cost between $4 billion and $8?billion.

I was wondering, where does that $4 to $8 billion come from?? Here’s an explanation from the internets:

Where does the FDIC get its money?
From assessments on insured banks, and interest on U.S. Government securities it holds.

How much do the insured banks pay the FDIC?
Insured banks pay annually a gross assessment of one-twelfth of 1 percent of their total deposits.

What direct commitment does the Treasury have to the FDIC?
The 1947 amendments to the Federal Deposit Insurance Corporation Act provide that the FDIC can borrow up to $3 billion from the U.S. Treasury at its discretion. The law directs the Secretary of the Treasury to put up this $3 billion any time the FDIC wants it.

NOTE: The website/book is from 1962, so the details may have changed since then (it references a $10,000 insured amount, which has obviously changed).

IndyMac had about $20 billion in deposits earlier in the year…? which means their annual assessment would have been around $17 million dollars…

Just like the PBGC, it may be self funded, but as soon as demand for coverage overwhelms that self-funding, it is ultimately the tax payers that are on the hook.

I just realized there is a easily accessible version of the TED Spread available online… from Bloomberg: the TED Spread.

Wikipedia explains the logic of the TED Spread:

…the TED spread is now calculated as the difference between the three month T-bill interest rate and three month LIBOR. The TED spread is a measure of liquidity and shows the degree to which banks are willing to lend money to one another.

There is a good reason that the LIBOR rate is getting pushed higher than the T-bill rate…? US Banks can go borrow in Europe without disclosing it — something they weren’t able to do in the US until the recent TAF and similar Fed sponsored bail outs programs were made available.

It’s noteworthy that the TED has started trending upward again over the last month or so.? This is an indication that more banking turmoil lies ahead…? although with IndyMac going down, Freddie and Fannie in the headlines, I’m surprised that this hasn’t spiked even higher.

It’s worth a quick note that a few great actively managed mutual funds have re-opened for new investors:

  • DODGX – Dodge & Cox Stock Fund – large cap value
  • LLPFX – Long Leaf Partners – large cap blend of growth and value
  • SEQUX – Sequoia – large cap growth
  • TASCX – small cap blend of growth and value

These mutual funds closed to new investors at various points in the past because their fund managers did not feel that the existing fund holders would benefit from new investors rushing in when performance was hot.? It’s not too common that a fund manager sides with their existing fund holders rather than growing their assets under management (more assets = more fees), so it’s worth noting when a manager does the right thing.

They’re all off their highs from last year, but for long term holdings, these mutual funds are a good bet.

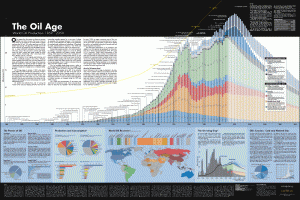
Peak OilI found this ginormous poster depicting Peak Oil over at an educational website appropriately named, PeakOil.org.

You can order your own physical copy for $12.50, or enjoy it online while spreading the message.

From the website: “The poster’s main chart features a year-by-year rendering of worldwide oil production from 1859 to 2050 with projections of future production based on Colin Campbell’s Oil Depletion Model.”

Warning, the picture is 1567px ? 1045px, which means you need a big monitor to see it all…

Most of my thoughts about bottoms recently have focused more on the beach-bathing variety I’m starting to see as spring creeps back to the beach. But since everyone is wondering about the market bottom, I’ll bounce the proverbial quarter off of it and see how high it goes.

I’ve talked before about market “gravity” and price clusters that attract future bids. It’s based on basic auction theory: the price that attracts the most bidding represents the best guess at the value of an item even if people who really want the item badly (or are ill-informed or excited) will pay more (or in reverse auctions, less).

I’ve advanced my work on the idea by taking to the computer and working with the R statistical platform to analyze markets from an auction theory perspective.

So how does the?S&P look in this context? (more…)

As a matter of course, in the past I’ve looked at quite a few municipal bond funds…  including those that are closed-end funds trading at a discount.  I even had large chunks of money in a municipal money market fund at one point…  these might be things to avoid for the near term.

From Peter Sedacca on Minyanville:

As a follow up to the couple of pieces I wrote on munis, the Shoe has officially dropped… like an anvil.

Sources are telling me that the municipal bond market has all but seized up. Bid list after bid list surface, but nothing trades. The reality is that the bids are 10-15 points under statement values.

I have also heard of a few muni arb funds liquidating and shutting down (these funds mainly buy munis and short govies when the spread is wide). Well, it will get wider, and wider, and wider, until the margin clerk arrives.

If I owned a muni fund, I would not trust the nav, particularly in closed end levered funds. Be careful, folks. And don’t panic…

Sounds scary.  Rather than "don’t panic", I would offer different advice — panic early, beat the rush. 

Mish has more on his blog, a "forced unwind in leverage is now underway…  Anyone over-leveraged in anything right now should be scared half to death."

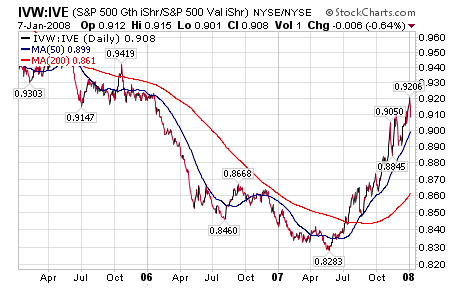
John mentioned a little while ago an opinion that Growth was set to outperform for a while… I took it upon myself to follow up on this fact, and the results are quite impressive.

Comparing the Growth stocks in the S&P 500 against the Value stocks (as defined by the IVW = Growth and IVE = Value SPDR ETFs), Growth is in fact putting in an impressive performance (this is a 3 year view):

As the growth etf performs better than the value etf, the line rises. Since May of 2007, growth has been on a tear. As a form of kudos, John’s note about Growth outperforming was posted on May 14… right at the nadir on the above graph.

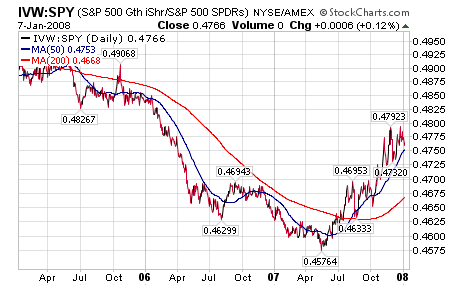
Likewise, Growth is outperforming the entire S&P 500:

While we’ve seen a few high-flying growth stocks take a beating recently during market dips (see GOOG, AAPL, etc.), these stocks as a group are actually doing quite well. During market declines, the outperformance would take the form of falling less in aggregate.

It is amusing to hear all the gold bulls, and more recently the mainstream media, proclaim that the Fed is “pumping liquidity” into the system. The logical conclusion is that either the Fed is going to ruin the dollar or save the stock markets, depending on who is talking.

But John Hussman has a different take on it… all the “pumping” is simply the roll-over of short term paper lent to banks. Here is a quote from his December 17 commentary:

Last week, the Fed executed the first of its highly publicized ?term auction? transactions. As I noted in A Little Acid Test for Fed ?Liquidity? last week, the Fed had $53 billion in repos outstanding on Friday December 14, fully $39 billion of which were due to expire last week. This ensured that the Fed would initiate new repos of a similar amount. The acid test was whether the term auction repos would represent a) new liquidity, or b) just a different way of rolling over the same money. Last week, we learned the answer to that question is b.

This will be something to watch, as Hussman points out in Monday’s notes:

…on Friday January 4, the huge 16-day 350 billion EUR refinancing from December 19 expires. This ensures that the media will (misleadingly) report a huge apparent injection of liquidity by the ECB on Friday. The question is how huge.

…As for the Fed, a few of the short-term repos the Fed provided for holiday liquidity will expire on Thursday [Jan 3]. Until then, the extra $10 billion or so of repos in the system may put a bit of pressure on the Fed Funds rate, holding it below the target of 4.25% for a few days. The most likely day for any apparent “liquidity injection” will be that same day (Jan 3) due to the expiring repos…

Fascinating stuff, and quite interesting to peel back beneath the headlines about liquidity injection. Hussman recommends going directly to the Fed or ECB’s websites to see the data yourself; see his full articles for links and more detail on the topic.

« Previous PageNext Page »

Subscribe to Tasgall

Categories

Archives