Trading


With the silver price correcting 30% in 5 days recently, here is a little food for thought from Casey Research…

silver.png

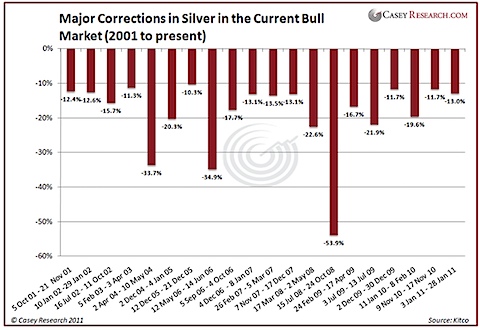
Silver has dropped more than 30% only three times previously in the current bull market (since 2001).

I don’t think the bull market is over, but I also don’t think the correction is over. The previous times that silver dropped more than 30%, it took much longer than 5 days for the correction low to be in place.

Well, we didn’t get much of a bounce on Monday… that doesn’t bode well for the overall direction of the markets.

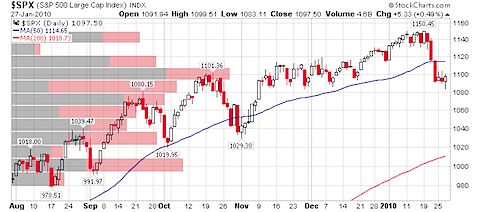
I ran some quick vol-by-price charts, and thought I would share. We’ve dropped 5% back into a pretty good congestion zone. A lot of shares have traded near current prices… We could very well wobble around in this range for a while yet. (chart source)

201001280741.jpg

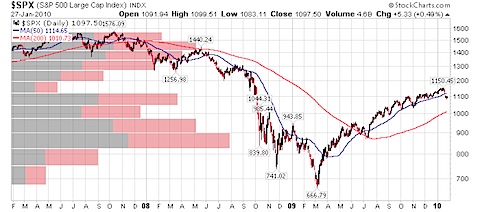
And here’s the longer term (3 year) chart:

201001280743.jpg

Looks like there is some bigger price gravity between 800-900 and back up around 1450. There are compelling arguments for going in either direction, so be careful with your commitments in one direction or the other.

In case anyone isn’t aware of the percentages, the last two days wiped out (and then some) all the gains so far in 2010.

While the S&P has only dropped 5%, it has happened in only 3 days.

I’m positioned for a bounce Monday morning, the three day drop is “too far too fast”. But I don’t expect a bounce to last.

And I consider this the warning shot that good times are over. If there is a bounce, it will likely be short lived. Then we can expect to see lower highs and lower lows… basically a return to a bear market.

When I make observations like this, I like to identify what would indicate that my analysis was incorrect. In this case, if the S&P is able to crawl back above 1150… especially if it is able to do so on higher volume.

Side Note: It’s worth commenting that 1150 was just a hair over a 50% retracement from 1576 all the way down to 666 (the 50% level was actually 1121).

Fascinating stuff from Barron’s

But a less-noticed intrigue occurs on the date when Russell measures stock-market caps to determine index membership. It is May 29 this year. Working as a trader at Morgan Stanley some years back, Rosenthal noticed stocks that surged suspiciously up the ranks on the day Russell took its snapshot. “People actually forced stuff in…that is just evil,” says the finance prof. “It isn’t like you figured something out, but that you made it happen.”

Those suspicions seem borne out by the data of Zhan Onayev and Vladimir Zdorovtsov, researchers at State Street who studied the past nine years of Russell reconstitutions. Among the stocks that just squeaked above the Russell 2000 threshold, a disproportionate share of the gains for May occurred on that measurement date — in- deed, in the last minutes of that day.

…Last year, about 200 new additions made it over the Russell 2000 threshold, which was the market cap of the 3000th stock at the close of May 30, 2008-or $167 million. In this year’s still-recovering market, analysts like Citigroup’s Lori Calvasina predict the cutoff will be down around $72 million. A would-be manipulator might hoard illiquid stocks with market caps under that level, in hope of pushing them up on May 29.

The easy way to curtail this sort of stuff would be to take the average market cap over a period of time (say, 6 months) as criteria for inclusion…

Kinda similar, Friday’s close was nothing short of spectacular. Karl Denninger has more over at his blog, but suffice it to say, a rather large order showed up in the futures for the SPX  in the last minute (/ES is the S&P 500 e-mini futures contract). The total margin for the number of contracts pushed through was close to $22.5 million, with a dislocation that cost the order giver a whopping $1.25 million disadvantage for trying to push it through in the way they did.

I assume, and Dennninger agrees, that it was most likely a short position that got liquidated. But I think it raises more than a few eyebrows amongst those that are usually impervious to conspiracy theories…
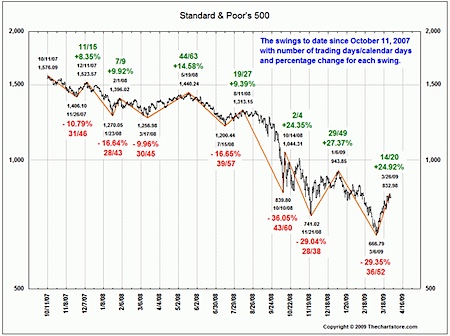
Fascinating overview chart of the S&P 500’s return, and the relative swings since Oct 2007.

200904032357.jpg

From The Chart Store via Ritholtz.

Apparently the CNBC Trading Contest is now over… Oddly enough, with my strategy of doing very little, I didn’t even notice that the contest finished up.

I’m quite impressed by my performance this year. My best portfolio ranked 5,673rd place at the end of the contest which put me in the top 1.1% of contestants with a cumulative gain of 73.6% since November 17 when the contest started (9 weeks).

Wow. If only I could boast about that type of return in my real trading accounts…

Here are the results broken out by portfolio:

  • Shiny (gold stocks) : +73.6%
  • Important (giants) : -8.4%
  • Dividend : -11.8%
  • Growth : +15.7%
  • ou812 : +5.3%

Incidentally, over the same time period the S&P 500 returned -2.2%.

Obviously, my Shiny portfolio benefited from the sector the holdings were in (Gold Stocks) more than anything, and gold stocks returned around 69% over the same period.

If only the other 5672 people who finished in front of me would be disqualified so I could compete in the final trading round…

Once again, CNBC is running their Million Dollar Portfolio Challenge. Once again, I am entering, with the intention of doing very little.

The rules this year are a little different… only 5 portfolios per person, and you can’t buy more than 25% of a given portfolio in a single stock / ETF. Oh, and they’re getting advertising money from starting to offer 10% of your portfolio in a Forex account.

Trading opened on Monday, and end-of-day purchases are all that is allowed.

I’m setting up 5 portfolios for fun:

  • Shiny – Gold stocks
    • Unfortunately, many of my favorite “moon-shot” stocks didn’t have sufficient market cap to be included in the trading game.
  • Important – giant companies that should fare the best in a contracting market
  • Dividend – some natural gas and oil trusts with high yields (despite the fact that dividends aren’t included in trading returns)
  • BDC – Business development companies
  • ou812 – the most popular of the last bull market — AAPL, AMZN, EBAY, GOOG, and BIDU

Each portfolio has an arbitrary (and silly) name… only to identify them to me. Also, I’ve decided not to use the Forex account for now, but may hop in with some long-term trend following system at a later point (if I have the energy).

After one day of trading, my best performer is in the top 4.4% (16,000th place) — the Important portfolio with a 2% gain.

We’ll see if my strategic buy and hold portfolios continue to do so well after more than one day…

Ok, people, if this?thing is going to happen, that obviously sets us up for a certain future, depending on your views. So, if you had $100,000 to invest in the aftermath of a bill passing and you had total flexibility (within reason, e.g. stocks, options, futures, metals, Treasuries, FX), do you have a bead on an optimal “Living-with-the-Bailout” portfolio/asset allocation plan? I’m stumped right now (or rather more concerned with stopping the bill that dealing with the aftereffects) but wondered if any of you smart dudes had one in the works. And I obviously know that you all will be concentrating on things like debt reduction etc. but I’m interested more in your ideas for profiting from this even if you don’t plan to actually pursue that route. I’d also like to see how the plan ties into your outlook for various markets.

Most of my thoughts about bottoms recently have focused more on the beach-bathing variety I’m starting to see as spring creeps back to the beach. But since everyone is wondering about the market bottom, I’ll bounce the proverbial quarter off of it and see how high it goes.

I’ve talked before about market “gravity” and price clusters that attract future bids. It’s based on basic auction theory: the price that attracts the most bidding represents the best guess at the value of an item even if people who really want the item badly (or are ill-informed or excited) will pay more (or in reverse auctions, less).

I’ve advanced my work on the idea by taking to the computer and working with the R statistical platform to analyze markets from an auction theory perspective.

So how does the?S&P look in this context? (more…)

I thought these suggestions for traders?from NakedShorts was too good to not repeat here:

  • It is far more important to look to simplicity (and common sense) than it is to look to increasing complexity as a means to better control investment outcome.
  • A model whose robustness is unknown or unknowable should never be employed.
  • Sophisticated tools should only be used if it is possible to verify that all required assumptions are satisfied (at least to a good approximation).? When this condition can be met, a simple application of a sophisticated technique is preferable to a complicated one.
  • Next Page »

    Subscribe to Tasgall

    Categories

    Archives